
'%3e%3cpath%20d='m222.077%2039.192-8.019%20125.923-76.671-165.115zm-53.105%20162.825-57.933%2033.056-57.934-33.056%2011.783-28.556h92.301zm-57.933-139.342%2030.357%2073.803h-60.715zm-103.102%20102.44-7.937-125.923%2084.69-39.192z'%20fill='url(%23a)'/%3e%3cpath%20d='m222.077%2039.192-8.019%20125.923-76.671-165.115zm-53.105%20162.825-57.933%2033.056-57.934-33.056%2011.783-28.556h92.301zm-57.933-139.342%2030.357%2073.803h-60.715zm-103.102%20102.44-7.937-125.923%2084.69-39.192z'%20fill='url(%23b)'/%3e%3c/g%3e%3c/svg%3e)
Angular Debugging Tips and Tricks
In this post, we will cover some handy tips and tricks for debugging Angular apps. For this post, we will be using an Angular CLI project and do some debugging with the NG Pokedex demo app. We will cover some of the following types of errors and debugging tips:
Augury
First, we will cover a helpful Chrome add a tool called Augury. You can download Augury at augury.angular.io. Augury combines some useful tools that allow us to understand our Angular apps better. We can view things like the component tree and how our app is broken up. We can inspect each component and see its properties and events associated with it.
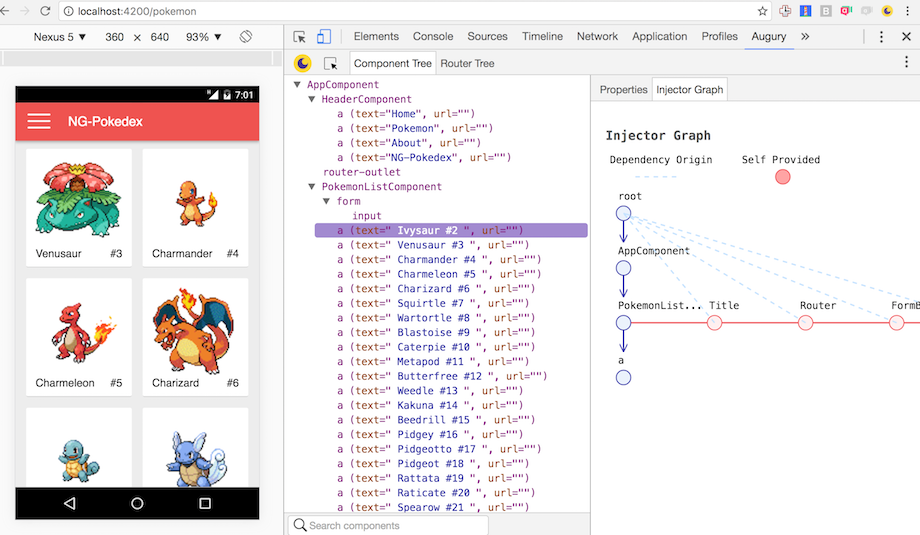
Another helpful feature of Augury is the ability to see the injector graph for the dependency injection system. This helps us visualize the dependencies in our project. There is a router inspector as well to see what active routes are available in our app. Note to use Augury you must make sure you Angular app is in development mode. If you call enableProdMode() in your app, Angular will disable the debugging hooks Augury needs at development time to give us the useful information about our app.
TypeScript Types
One of the great features of Angular is the use of TypeScript as it's primary language. Modern Angular apps are written in TypeScript, and we get a lot of benefit with it.
With TypeScript, we get static type checking and features like interfaces. TypeScript is essentially the latest JavaScript + optional static types. What does that do for us? Well, it prevents us from accidentally passing the wrong types around. The example we have a simple add function, and with TypeScript's type annotations, silly errors like accidentally passing a string when it should be a number.
Another great feature of TypeScript is the ability to create interfaces. Interfaces are like contracts for what your objects and data structures should look like. This allows us to make sure like the example above that we have the correct object. Our editors can give us some better information about what object we are using.
TypeScript Source Maps
We see that TypeScript can help catch some bugs at development time but what if we need to debug and step through code in the browser? Well with the Angular CLI we get extra generated files called source maps to help us out.
As we can see below, this is what our simple about component looks like after the TypeScript has been compiled down to plain ES5 JavaScript. It's not terrible looking we can understand what it's doing, but we can get a better debugging experience with source maps.
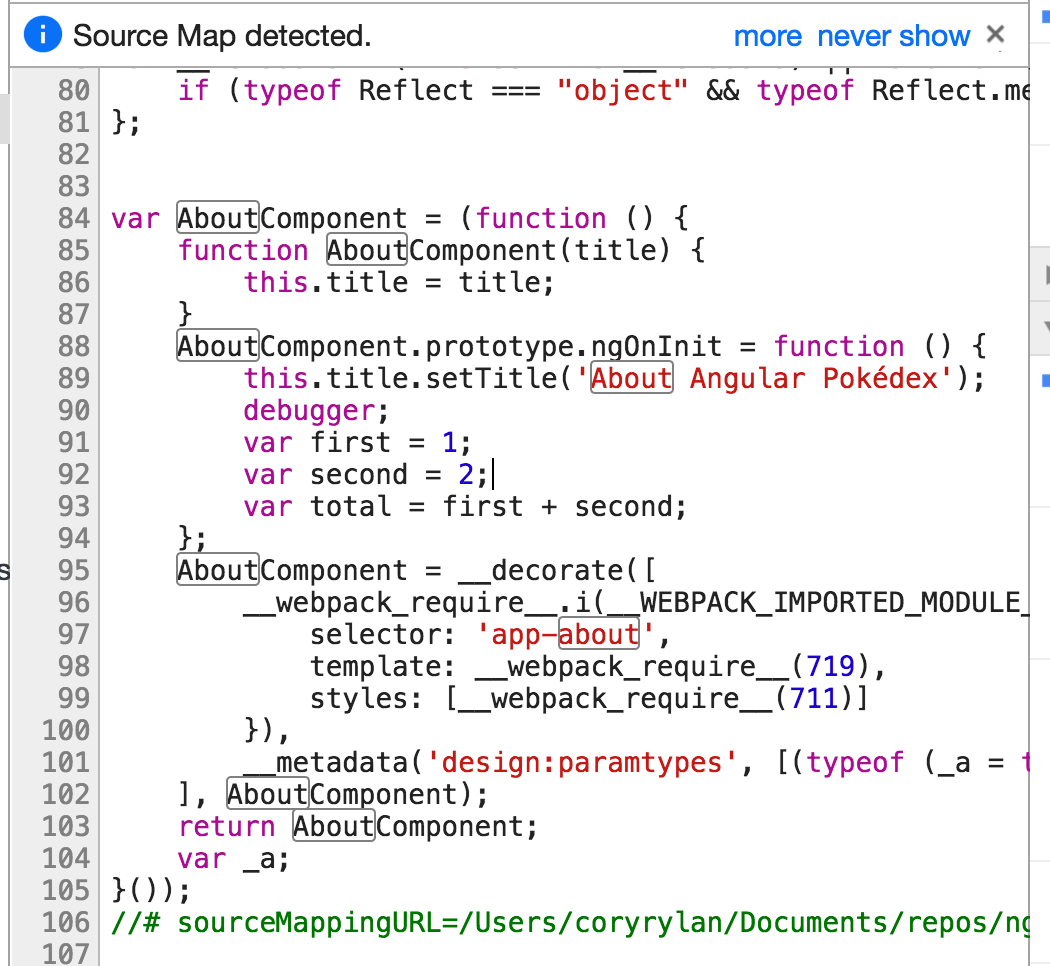
Source maps "map" our generated JavaScript to our TypeScript code. So if we use a debugger; statement to pause on our code, instead of Chrome showing the compiled ES5 JavaScript it will show us the TypeScript.
Chrome isn't using TypeScript but matching line for the line where the compiled JavaScript came from in our TypeScript code. This allows us to step through and debug our TypeScript code in the browser. Pretty useful!
TypeScript Runtime Errors
What happens if we get a runtime error in our application? What do our Angular app errors look like? Well, let's create an error in our AboutComponent.
import { Component, OnInit } from '@angular/core';
import { Title } from '@angular/platform-browser';

@Component({
  selector: 'app-about',
  templateUrl: './about.component.html',
  styleUrls: ['./about.component.scss']
})
export class AboutComponent implements OnInit {
  constructor(private title: Title) {}

  ngOnInit() {
    this.title.setTitle('About Angular Pokédex');
    this.method1();
  }

  method1() {
    this.method2();
  }

  method2() {
    this.method3();
  }

  method3() {
    throw new Error('Something bad happened.');
  }
}
So we will trigger an error when method3() is called. Let's look at how
Angular handles this.
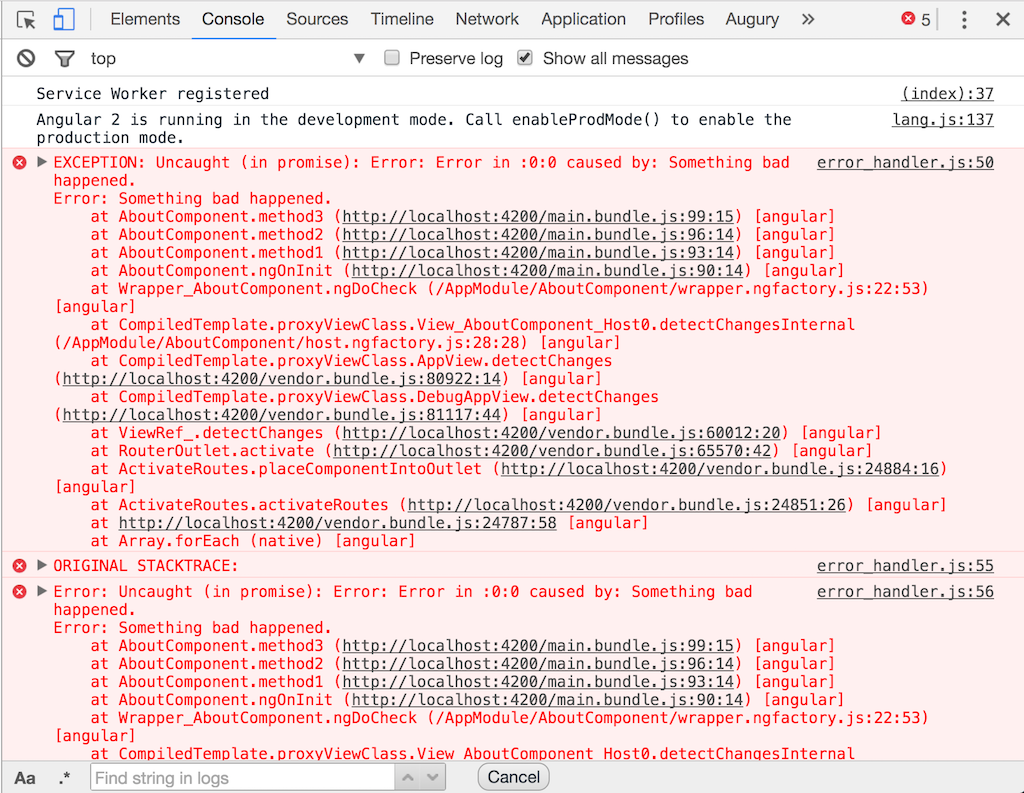
Wow, that is a lot of red. But if we look closely, we can see Angular has logged out the exact stack trace that triggered the error at the top of the console. If we click one of the links, it will take us straight to the code that ran and caused the issue.
So runtime and compile-time errors with Angular and TypeScript is pretty great. We get full stack traces and links directly to the code that caused the issue. What happens though when we have a bug in our templates/HTML?
Template Errors and the HTML Parser
The Angular built a custom HTML parser instead of using the browser for a few reasons. First, it allows out HTML templates to be case sensitive and also allows Angular to provide better errors in our templates. Let make a couple of simple errors in our component.
<h1>About</h1>

<ul>
  <li>
    Insperation from
  <a href="https://www.pokedex.org/">pokedex.org
  </li>
</ul>
If you notice in our About Template, we are missing a closing a tag on our last HTML anchor causing a HTML error. If we inspect the console, we will see a SyntaxError thrown with an exception message.
I look at the exception message we can see the Angular parser has pointed to the line of invalid HTML for us. Now, most editors and IDEs would pick up on a missing closing tag, but in the next example, we will see some even better template error handling.
Properties and Events
Some other common errors with Angular templates are simple typos with property and method names. In our about component lets make a few properties and a method to call from our template.
import { Component, OnInit } from '@angular/core';

@Component({
  selector: 'app-about',
  templateUrl: './about.component.html',
  styleUrls: ['./about.component.scss']
})
export class AboutComponent implements OnInit {
  message = 'Hello World';

  constructor(private title: Title) {}

  ngOnInit() {
    this.title.setTitle('About Angular Pokédex');
  }

  sayHello() {
    console.log(this.message);
  }
}
So in our AboutComponent we have a message property and sayHello() method that we will reference in our template.
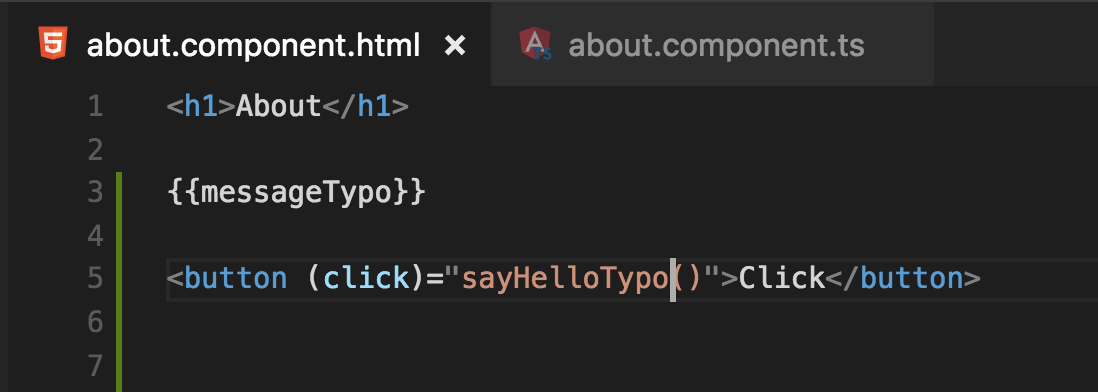
We can see we have a typo in our message property, but if we start our app there are no errors! Angular templates are somewhat tolerant of referencing properties that don't exist in our component. If the property doesn't exist, Angular won't show anything on the screen and doesn't give an error. Not super helpful but in the following example we will see how we can improve this behavior. Next, let's make a typo in our template and our click event call sayHelloTypo().
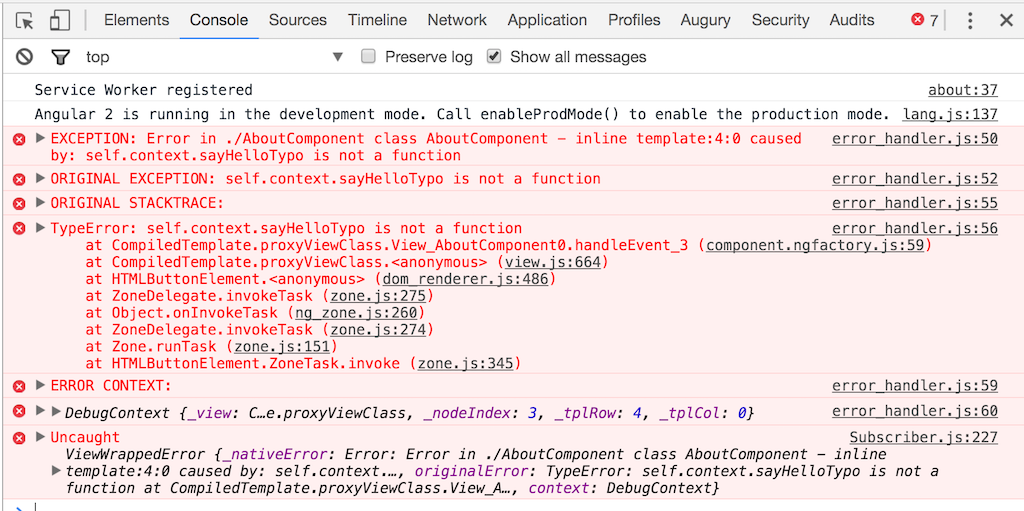
We have quite a bit in our error log but if we break it down its reasonably useful. Angular spits out the full stack trace but indeed just the first line is what we care about.
Error in ./AboutComponent class AboutComponent - inline template:4:0 caused by: self.context.sayHelloTypo is not a function
The first line tells us which component had the error and then the method that was attempted to be executed. These errors are great for debugging runtime errors but what can we do to improve our development experience in our editors?
Visual Studio Code and the Angular Language Service
The Angular team is working on a project called the Angular Language Service. This service acts as a plugin to our editor to allow our editor to understand our component templates better. With Angular's template syntax the Language Service can statically analyze our templates and help us catch errors early on in development.
So in the video, above we can see the Angular Language Service is allowing my editor (Visual Studio Code) to understand what properties and methods are available in my component for the template to use. This is a significant improvement and adds a lot of productivity to our development environment.
The Angular Language Service is in early Alpha, and you can try it out now by downloading the VSCode plugin here. VS Code Language Service. The language service is not specific to Visual Studio Code and will eventually make its way to other editors soon!
In summary, the latest Angular versions have some significant improvements in debugging over prior AngularJS 1.x versions. We can expect to see even more improvements as Angular matures.


%20--%3e)
%20--%3e)
