Analyzing bundle size with the Angular CLI and Webpack
Having a high performing web app is always a top priority. With Angular there is no exception. But with our web apps becoming ever so increasingly complex how we can know what gets bundled into our apps? How do we track the size of the bundles? We want to make sure we don't send too much JavaScript all at once and slow down our apps.
Large JavaScript bundles are a surefire way to lose user engagement. Not only are they slower to download but also more time-consuming to evaluate and execute by the browser. For our apps to stay fast, we need to make sure they stayed small (250kb or less is a good goal) and loaded at the appropriate times.
In this post we will use the Angular CLI and a few simple commands to get a detailed report about the Angular application bundles we ship to production.
Angular CLI
First, we need an app to inspect. For this demo we will use the NG-Pokedex app. The NG-Pokedex app is a small progressive web app built with the Angular CLI. We need to build our application for production. To do this, we can use the CLI and run ng build --prod --stats-json. This command will build and bundle/compress our application to be ready to deliver to a production server. We should see an output similar to the image below.

With these bundled and packaged files, we can deploy/host our Angular app on any server with relative ease. The --prod flag told the CLI to build our app for production but what did the --stats-json flag do? The CLI will generate a stats.json file in the dist with our bundles. This stats file has all kinds of useful data about our application bundles. If you look at the file its quite a bit of data so we need a tool to help digest and understand this data.
Webpack
The stats.json file specifically is a feature of Webpack. Webpack is the JavaScript package/bundling tool the CLI uses under the hood. With this special file Webpack generated for us, we can use a few different tools to understand our app.
The tool we will use is the Webpack bundle analyzer. Webpack bundle analyzer is an npm package you can use in a Webpack config or just as a command line tool. For our use case, we will simply use the command line tool.
To use this tool use the following steps:
- Install via npm to your CLI project:
npm install --save-dev webpack-bundle-analyzer - Once installed add the following entry to the npm scripts in the
package.json:
"bundle-report": "webpack-bundle-analyzer dist/stats.json" - Once added run the following command:
npm run bundle-report
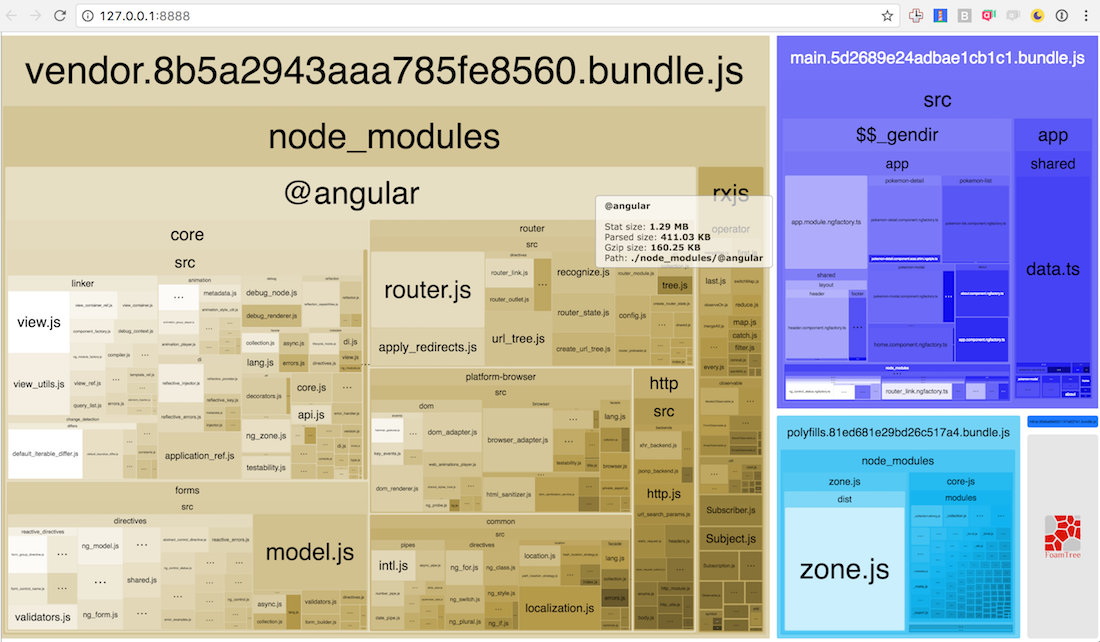
If followed correctly the Webpack bundle analyzer will open a report in your browser window that will look something like this:

What does this chart tell us? Each color represents an individual bundle. In our application, we have three bundles, the vendor that contains all the library code, the polyfill bundle, and the main application code bundle. We can further inspect each bundle and see the uncompressed and compressed sizes. This allows us to quickly determine what parts of our code are the largest and we can also decide whether we need to break our app up further using
Lazy Loading.
For the NG-Pokédex we can see the majority of the application is framework code. Since the app is small, it has only a few components bundled in the main code bundle. Using this tool I was able to identify that the Http Module from Angular was being bundled into the ng-pokédex app even though it wasn't being used. I removed the unused imports, and now the app is smaller and faster than before.
As our apps grow, we can just run npm run bundle-report to closely monitor our dependencies and how they affect the bundle sizes keeping our apps lightweight and fast!
Feel free to check out the NG-Pokédex app at the link below!

