
'%3e%3cpath%20d='m222.077%2039.192-8.019%20125.923-76.671-165.115zm-53.105%20162.825-57.933%2033.056-57.934-33.056%2011.783-28.556h92.301zm-57.933-139.342%2030.357%2073.803h-60.715zm-103.102%20102.44-7.937-125.923%2084.69-39.192z'%20fill='url(%23a)'/%3e%3cpath%20d='m222.077%2039.192-8.019%20125.923-76.671-165.115zm-53.105%20162.825-57.933%2033.056-57.934-33.056%2011.783-28.556h92.301zm-57.933-139.342%2030.357%2073.803h-60.715zm-103.102%20102.44-7.937-125.923%2084.69-39.192z'%20fill='url(%23b)'/%3e%3c/g%3e%3c/svg%3e)
Measuring Angular Performance with Source Map Explorer
Cory Rylan
- 2 minutes
Web Performance is becoming more and more demanding as Web applications
continue to grow in size and complexity. One of the biggest culprits of Web Performance issues is JavaScript. JavaScript can be slow to download but also slow to execute depending on the network and device capabilities.
To keep Angular performance fast we can use lazy loading and dynamic imports to load code as needed on demand. This can greatly reduce the amount of JavaScript required to load and run on the client. However, even when following best practices, sometimes a single third party dependency can break all performance progress.
In this post, we will see how we can better understand what JavaScript we are sending down to the client within our Angular applications.
Angular CLI
To understand our Angular application's performance characteristics, we will need to build our app with the production flag to ensure we are testing with what our prod environment will be using.
In the root of the Angular CLI project, we can execute the following:
ng build --prod --source-mapThis command will build our Angular application with all the optimization the Angular CLI uses and produce source map files of the output code. The source maps allow the compiled final output to be mapped to its original code before compilation.
With the source maps, we can use a tool like source-map-explorer to inspect and show precisely what code is being sent to the client. To use Source Map Explorer, you will need to install via NPM.
npm install source-map-explorerOnce installed, we can add it as an NPM script to the package.json in our Angular application.
{
  "bundle:report": "source-map-explorer dist/demo-app/**/*.js"
}
When we run our script npm run bundle:report, we will get the output in the browser.
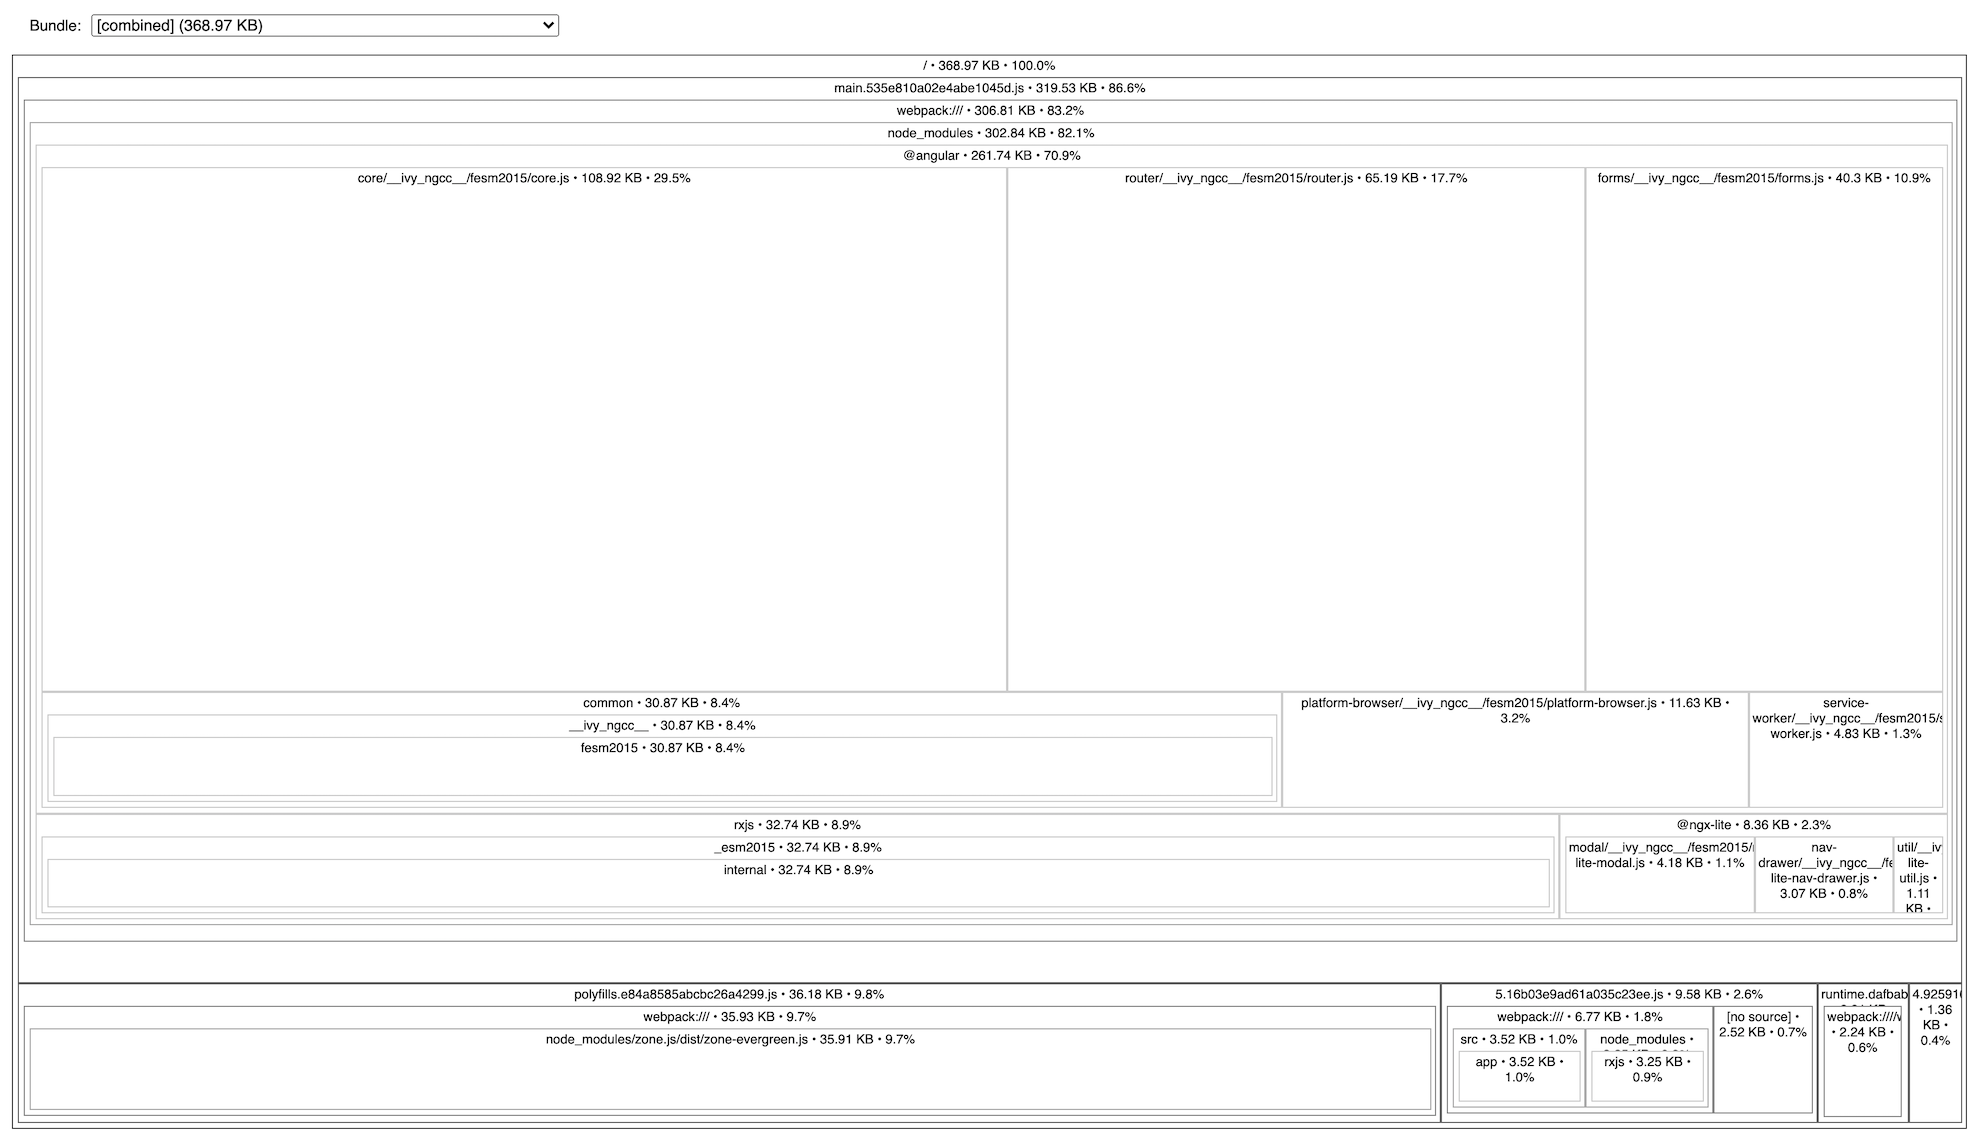
Here we can see the output of the ng-pokedex project. We can see all the JavaScript and dependencies within each JavaScript bundle. This visualization makes it easy to identify what code is being loaded.
While the Angular CLI uses Webpack for some of its bundling, it also makes additional optimizations on top of Webpack. Because of these optimizations, it's important to use the source-map-explorer to test the final output and not the webpack-bundle-analyzer that is commonly used with Webpack based applications.
You can find the demo application on Github in the link below!


%20--%3e)
%20--%3e)
